Weekly Austin Real Estate Market Update
Austin Real Estate Weekly Market Update – July 24, 2025
by: Dan Price, Broker at Team Price Real Estate
Austin's leading data analysis brokerage, where data drives exceptional service
Published on: Thursday, July 24, 2025 at 05:38 am
Austin Market Update: Inventory Climbs, Buyer Leverage Strengthens
The Austin housing market continues to rebalance as active listings reach 17,891—up 10.9% year over year—pushing Months of Inventory to 6.13. This steady rise in supply is tipping the scales in favor of buyers. While the average sold price in the Austin-Area MLS rose 1.9% to $566,519, the median sold price fell 3.0% to $422,000, revealing a market where higher-end sales mask broader pricing weakness.
Inside the City of Austin, inventory has jumped 14.0% to 5,692 active listings, with Months of Inventory now at 6.74. Pricing remains relatively stable: the median sold price rose 1.8% to $575,000, while the average sold price increased 5.5% to $773,415. The market is showing signs of stratification, where well-priced homes still move, but broad-based pricing power has softened. Sellers must adjust to slower absorption and more aggressive negotiation, while buyers are benefiting from increased choices and narrowing price gaps.

Austin Real Estate Market Overview
Inventory levels across the Austin-Area MLS continue their steady climb, reinforcing a market still working through its rebalancing phase. Active residential listings have reached 17,891—up 10.9% from this time last year. Months of Inventory now stands at 6.13, a year-over-year increase of 11.6%, confirming that supply is outpacing current buyer activity. In the City of Austin, the trend is more aggressive: listings are up 14.0%, and Months of Inventory has risen from 5.94 to 6.74—a 13.4% expansion. With supply rising faster than demand across nearly all segments, buyers now enjoy more leverage, longer decision windows, and stronger negotiating position.
Austin Housing Prices: High-End Strength Masks Mid-Tier Softness
Price movement continues to diverge between the upper and mid-market tiers. Across the Austin-Area MLS, the average list price is up just 1.89% year over year to $584,125, while the median list price has declined 1.2% to $434,900. The average sold price rose 1.9% to $566,519, but the median sold price dropped 3.0% to $422,000. This growing spread between average and median reflects strength in high-end sales, but persistent affordability challenges for the broader buyer pool.
In the City of Austin, pricing is more resilient. The median sold price increased 1.8% to $575,000, while the average sold price climbed 5.5% to $773,415. Sellers at the top of the market are still finding buyers, but absorption rates remain slow overall. The average list price in Austin is now $804,541, up 6.2% from last year, while the median list price rose 3.5% to $595,000—further evidence that luxury and near-luxury listings are supporting headline numbers, even as mid-level price points face pressure.
Regional Trends: Correction Widens Across Central Texas
Market correction remains widespread throughout Central Texas. Of the 30 tracked cities, only 11 (37%) saw month-over-month price increases, while 19 (63%) experienced price declines. Year over year, just 9 cities (30%) recorded price gains, while 20 (67%) posted declines. Notably, all 30 cities remain below their 12-month price peaks, underscoring the persistent downward price pressure across the region.
At the ZIP code level, results are slightly more mixed: 53% (40 out of 75) showed monthly gains, while 47% saw declines. However, only 40% of ZIP codes are up year over year, and 60% are still down. Just 2 of 75 ZIP codes have surpassed their price peak from the last 12 months—confirming that most submarkets are still in reset mode, with localized momentum rather than broad-based recovery.
List-to-Sale Price Performance: Buyer Leverage Expands
Price negotiation continues to characterize the market. As of this month, 69.1% of sold homes closed below list price—up from 65.8% last month. Just 17.97% sold exactly at asking, while 12.96% sold over list, slightly down from 13.2% in July 2024. The average sold-to-list price ratio sits at 97.19%, reinforcing that sellers are frequently conceding during negotiations. Buyers are pushing harder on price, while sellers must position their homes competitively from the outset to avoid extended time on market and repeated price reductions.
Peak Value Trends: Market Remains Well Below Historic Highs
Despite some seasonal stability, current pricing remains well below peak values. In the Austin-Area MLS, the average list price has declined 12.2% from its April 2025 high of $712,429 to $625,398. The median list price is down 14.8% from the May 2022 peak of $539,900, now sitting at $460,000. The average sold price has fallen 12.6% from the May 2022 high of $664,515 to $580,761, while the median sold price has dropped 19.1%, from $538,000 to $435,000. Average and median price per square foot are down 18.8% and 23.2%, respectively.
The City of Austin shows a similar retreat. The average list price is down 13.4% from the April 2025 peak of $946,391, now at $819,527. The median list price has declined 12.1%, from $659,000 to $579,450. On the sales side, the average sold price has fallen 10.3% from its May 2022 peak, now at $760,401. The median sold price is off 15.4%, from $680,000 to $575,000. Price per square foot metrics in the city have also dropped significantly, with both average and median down over 20%, reflecting the depth of the broader correction.
Austin Area Residential Sales Insights
Top 5 Austin Real Estate Questions
1. Is Austin officially in a buyer’s market right now?
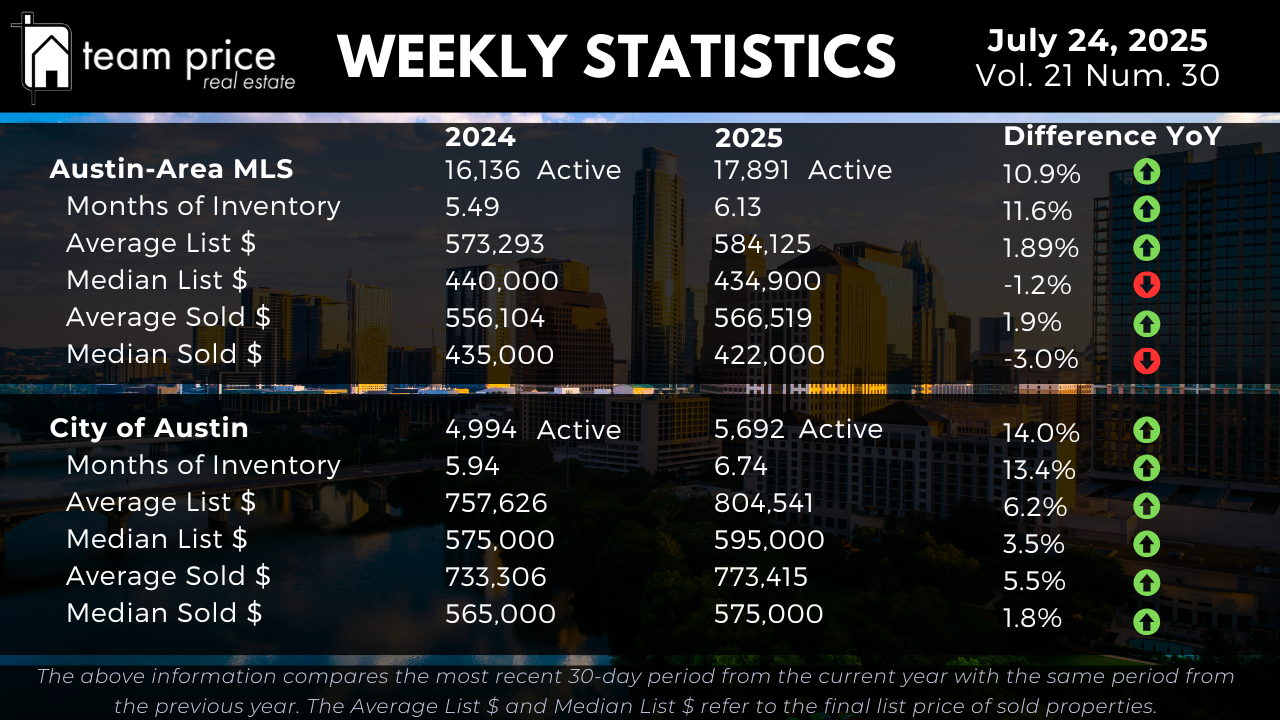
Not yet, but we’re heading that way. Technically, a buyer’s market is defined as having more than seven months of inventory—and right now, the Austin-Area MLS sits at 6.13 months. That’s up from 5.49 just a year ago. In the City of Austin, we’re even closer at 6.74 months. So, while we’re not officially in a buyer’s market, the trajectory is clear. Buyers are gaining leverage. Homes are staying on the market longer, sellers are negotiating more, and price sensitivity is creeping back into nearly every price point. If this trend continues, we’ll likely cross that seven-month threshold soon, which would mark a formal transition into buyer-market conditions.
2. How much negotiating power do buyers have right now?
Buyers have more leverage today than they’ve had in years. Nearly 70% of homes across the Austin-Area MLS are now selling below their asking price. That’s a notable shift from where we were a year ago, and even a few months ago. The average sold-to-list price ratio is currently at 97.19%, which means sellers are typically accepting offers about three percent below what they listed for. On top of that, only about 18% of homes are closing at full list price, and less than 13% are going over asking. For buyers, this translates into more room to negotiate, more time to make decisions, and less pressure to rush into offers—especially in price points above $500,000 where competition has thinned out.
3. Are higher-end homes holding value better than mid-range homes?
They are, and that’s an important nuance in the market right now. When you look at the average sold price in the Austin-Area MLS, it's up 1.9% year over year, sitting at around $566,519. But the median sold price—which represents the true middle of the market—is actually down three percent, now at $422,000. What that tells us is that the higher-end homes are skewing the averages upward, while the broader middle of the market is still under pressure. We’re seeing the same trend in the City of Austin. Average prices have jumped 5.5% to just over $773,000, but the median is only up 1.8%, landing at $575,000. That spread reveals what’s really happening: the luxury tier is still moving, often with cash or jumbo loan buyers, while the mid-market is where affordability is tightest and price resistance is strongest.
4. Are most neighborhoods in Austin stabilizing, or are we still in a correction?
We’re still in a correction across most of the metro. It’s uneven, and while some pockets are starting to stabilize, the broader trend is still one of price softness. Across 30 tracked cities in the area, only 11 posted a month-over-month price gain, while 19 saw declines. That means about two-thirds of the cities are still moving backward in terms of value. When we zoom in to the ZIP code level, about 53% showed price increases over the past month—but 47% declined. Only two ZIP codes have surpassed their price peaks from the past 12 months. That’s critical. It shows that while you might find a few bright spots—usually in low-inventory neighborhoods or high-demand school zones—the majority of the market hasn’t recovered peak pricing. The correction isn’t over, even if it’s not as sharp as it was in late 2022.
5. How far are prices from their peak, and are we likely to return there soon?
Prices are still well below their peak, and there’s no evidence yet that we’re heading back to those highs anytime soon. In the Austin-Area MLS, the median sold price has fallen about 19% from the peak of $538,000 in May 2022 to $435,000 today. The average sold price is down roughly 12.6% from its high. When you break it down by price per square foot, the drop is even steeper—over 18% lower for the average and more than 23% down for the median. In the City of Austin, we’re seeing a similar pattern. The median sold price peaked at $680,000 and now sits at $575,000, which is about a 15% decline. Price per square foot in Austin is down more than 20%. So, even though some sellers are holding the line on list prices, the actual sold data confirms we’re still in a lower-value cycle. This isn’t a crash, but it is a real and measurable market reset.